

The heat stress index chart identifies four danger levels, Caution, Extreme Caution, Danger, and Extreme Danger, and reading it correctly is only the first step. Each zone requires specific supervisor actions, and the chart itself carries documented assumptions that cause it to systematically understate risk in common industrial and outdoor work conditions.
This guide explains how to read the heat stress index chart, what each danger level requires of supervisors and workers, where the standard chart falls short, and how Wet Bulb Globe Temperature (WBGT) and OSHA heat exposure guidelines extend its usefulness for occupational settings. If you are building or auditing a heat safety program, this is the reference that connects the chart to the actions it requires.
You can also check out our free heat index calculator and specify your requirements for an analysis based on your working environment..
Key Takeaways
- The National Weather Service (NWS) heat stress index chart assumes full shade and approximately 5 mph of air movement. Direct sunlight can add up to 15°F to the apparent temperature reading, meaning chart values may understate actual risk for outdoor workers.
- The Rothfusz regression equation underlying the NWS heat index chart produces unreliable outputs below approximately 40% relative humidity (RH). Workers in arid climates can face dangerous conditions the standard chart does not flag accurately.
- At heat index values above 103°F (the Danger zone), OSHA's heat illness prevention framework recommends structured work/rest ratios and acclimatization schedules, especially for workers in their first one to two weeks on the job.
- Workers wearing impermeable clothing or full personal protective equipment (PPE) cannot dissipate heat through sweat evaporation efficiently. Their effective heat stress can exceed the ambient heat index reading by several equivalent degrees.
- WBGT accounts for solar radiation and air movement that the standard heat index formula omits. It is the basis for American Conference of Governmental Industrial Hygienists (ACGIH) Threshold Limit Values (TLVs) for heat stress and should be used when the standard chart conditions do not apply.
- Indoor facilities with uncontrolled humidity can experience heat index values that cross danger zone thresholds even when outdoor conditions are moderate. Applying the same heat stress index chart methodology indoors is a legitimate and necessary occupational safety practice.
What the Heat Stress Index Chart Actually Measures
The heat stress index, also called the apparent temperature or "feels like" temperature, estimates how hot conditions feel to the human body by combining dry-bulb air temperature with relative humidity. The NWS publishes the authoritative chart based on the Rothfusz regression equation, detailed in NWS Technical Attachment SR 90-23, 1990. This is a multi-variable polynomial regression, not a simple addition of temperature and humidity values.
Understanding what the chart measures and what it omits is not atmospheric background. It is context you need before you can apply the chart correctly in a field safety program.
The Key Variables: Temperature and Relative Humidity
High relative humidity reduces the body's ability to cool itself through sweat evaporation. When ambient air already holds substantial moisture, sweat evaporates more slowly, and body temperature regulation becomes less effective. The result is that moderate air temperatures become genuinely dangerous at high humidity levels. At 90°F with 90% RH, the NWS chart indicates an apparent temperature of approximately 122°F.
For more on how relative humidity functions as a physical variable, that resource provides a facility-focused explanation.
What the Chart Assumes (and Why That Matters)
The NWS heat index chart is calculated assuming full shade, light air movement of approximately 5 mph, and an average-sized adult. These assumptions make the chart a baseline, not a ceiling. Real-world conditions frequently require upward adjustment. A safety officer who treats the chart reading as the definitive felt temperature will consistently underestimate risk for workers in direct sun, still-air environments, or heavy PPE.
How to Read the Heat Stress Index Chart Step by Step
Reading the heat stress index chart is a physical skill, not just a lookup task. Digital tools are not always available on a job site, and knowing how to use the printed chart correctly is a core competency for any supervisor managing heat risk.
Follow these four steps with the printed chart:
- Find the current air temperature column along the top horizontal axis.
- Locate the relative humidity row along the left vertical axis.
- Find the intersection cell. That value is the apparent temperature.
- Match the apparent temperature to the color-coded heat index risk levels: Caution, Extreme Caution, Danger, or Extreme Danger.
For precise values when a device is available, the NWS offers a free Heat Index Calculator online.
Finding Your Temperature-Humidity Intersection
Consider a realistic industrial example: air temperature of 92°F, relative humidity of 75%, per the heat index reference. The NWS chart places that intersection at approximately 120°F apparent temperature. That reading falls in the Danger zone, where heat exhaustion is likely and heat stroke is possible. A supervisor who checks only air temperature and sees 92°F may not recognize the actual danger zone temperature their workers are experiencing.
When Conditions Fall Between Chart Values
The chart is printed in discrete increments. Actual field measurements will rarely land exactly on a printed value. When conditions fall between listed values, always round toward the higher apparent temperature rather than averaging down. Underestimating apparent temperature translates directly to undertreating heat stress risk. One degree in the wrong direction can mean the difference between an Extreme Caution protocol and a Danger zone response.
The Four Danger Zones: What Each Level Requires
The heat index chart's color-coded zones correspond to specific heat-related illness risks and required supervisor actions. The table below does not exist in isolation from OSHA's heat illness prevention framework. Each zone has a corresponding level of protective action under OSHA's heat hazards guidance.
Caution and Extreme Caution: Early Warning Thresholds
Most workplace heat-related illness occurs in these two zones precisely because conditions do not feel extreme. Supervisors underestimate risk, and workers push through discomfort without requesting relief. These zones account for a significant share of occupational heat exposure incidents.
- Caution (80°F to 90°F apparent temperature): Fatigue is possible with prolonged exposure. Require regular hydration and active monitoring of workers showing early symptoms.
- Extreme Caution (91°F to 103°F apparent temperature): Heat cramps and heat exhaustion become possible, according to the National Weather Service heat index scale. Mandate rest breaks, provide shade access, and monitor all workers closely, especially those who are new or returning from time off.
- Required actions for both zones: Hydration of at least one cup of water every 15 to 20 minutes, shade or cool rest areas within close proximity, buddy-system monitoring for early heat-related illness symptoms including heavy sweating, weakness, and nausea, and active cooling strategies such as fans, misting, or air-conditioned rest areas where available, consistent with CDC heat safety recommendations for outdoor and industrial workers.
Danger and Extreme Danger: When Work Protocols Must Change
The upper two zones require mandatory protocol changes, not just enhanced monitoring. Heat stroke risk is real and immediate above 103°F apparent temperature. Unacclimatized workers are disproportionately vulnerable. OSHA guidance notes that acclimatization typically requires 7 to 14 days of graduated exposure, with new workers introduced to no more than 20% of normal heat exposure on day one, increasing incrementally.
- Danger (103°F to 124°F apparent temperature): Heat exhaustion is likely. Heat stroke is possible. Structured work/rest ratios are required. Unacclimatized workers should not be assigned strenuous tasks. Close supervisor monitoring at all times.
- Extreme Danger (above 125°F apparent temperature): Heat stroke is imminent. This is the zone where an extreme heat warning from the National Weather Service typically applies. Non-essential work should stop. Only emergency operations with full monitoring and medical support should continue.
- Acclimatization requirement: New and returning workers must follow a graduated schedule regardless of where the heat index falls. Experienced acclimatized workers still require structured rest in the Danger zone. No worker is exempt from water, rest, and shade protocols in these zones.
Where the Standard Chart Understates Risk
Three specific conditions routinely cause the standard heat stress index chart to understate actual worker heat exposure. Each is well documented, and each is commonly encountered in industrial and outdoor work environments.
The Sunlight Correction: Why Outdoor Readings Need Adjustment
The NWS documents that direct solar radiation adds up to 15°F to the apparent temperature compared to the chart's shade-based calculation. A worker in full sun at a chart-indicated 95°F apparent temperature may be experiencing conditions equivalent to 110°F.
That reading moves from the Extreme Caution zone to the Danger zone without the ambient conditions changing at all. At wind speeds below 5 mph, the gap widens further because convective cooling is reduced below the chart's assumed baseline.
PPE and Impermeable Clothing as a Heat Stress Multiplier
When sweat cannot evaporate from the skin surface, body temperature regulation fails faster than the ambient heat index suggests. Workers wearing chemical-protective suits, impermeable coveralls, or heavy full-body PPE lose the evaporative cooling mechanism that the heat index formula assumes is functioning.
Their effective heat stress can be equivalent to several additional degrees of apparent temperature above the ambient reading. OSHA's Technical Manual, Section III, Chapter 4 addresses PPE as a heat stress modifier directly. Safety officers managing hazmat, chemical processing, or industrial cleaning operations should calculate separate exposure limits for workers in impermeable clothing rather than applying ambient heat index thresholds.
When to Use WBGT Instead of the Standard Heat Index Chart
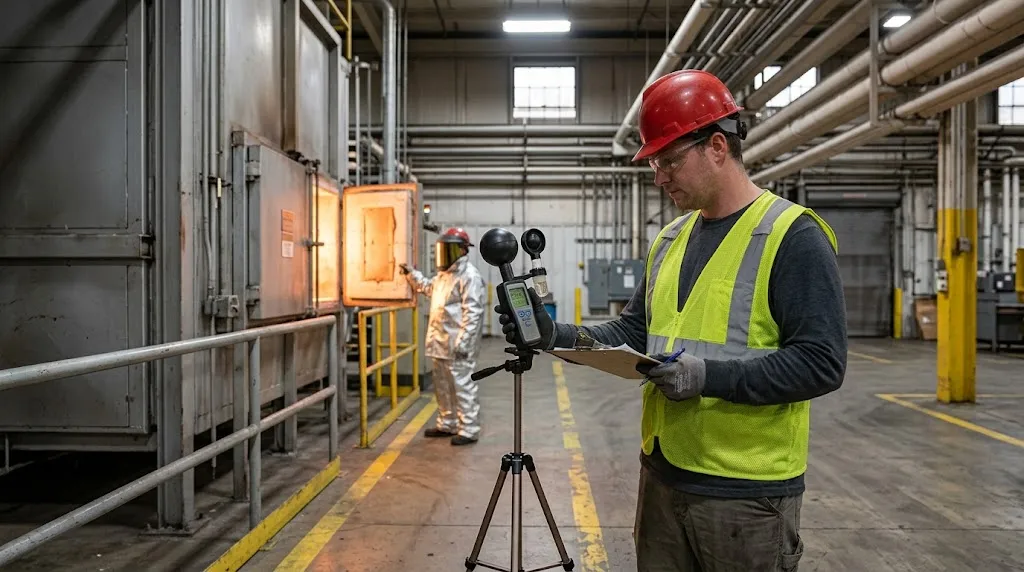
Wet Bulb Globe Temperature (WBGT) is a composite index incorporating dry-bulb temperature, natural wet-bulb temperature, and black globe temperature. The natural wet-bulb component reflects humidity and evaporation rate. The black globe component reflects radiant heat load and air movement. Together, these make WBGT sensitive to the variables the standard heat index chart does not capture. For outdoor worksites, facilities with radiant heat sources, or environments where workers wear PPE, WBGT is the more accurate tool.
WBGT is also the basis for ACGIH TLVs for heat stress and strain. Safety officers who use only the standard heat index chart may not recognize when ACGIH TLV thresholds are being crossed. Portable WBGT meters and field apps are widely available. The NWS HeatRisk tool incorporates WBGT-adjacent variables for public forecasting and can supplement field measurements.
The Chart's Documented Failure at Low Relative Humidity
The Rothfusz equation produces unreliable outputs below approximately 40% RH and below 80°F air temperature. This is a limitation documented in the original NWS Technical Attachment. In arid climates or during dry-heat conditions, the chart may indicate apparent temperatures that understate actual physiological heat stress. Safety officers managing facilities in the desert Southwest, or any dry-climate industrial site, should verify heat stress readings with WBGT rather than relying solely on the heat stress index chart. The chart was not designed for those conditions, and treating it as authoritative in that context is a program gap.
ACGIH TLVs and Work/Rest Ratios by Workload Category
WBGT-based TLVs are adjusted based on metabolic heat generated by work intensity, expressed in four categories: light, moderate, heavy, and very heavy. Each workload-WBGT combination maps to a specific work/rest ratio. A worker performing heavy physical labor in moderate ambient heat may exceed TLV thresholds even when the standard heat index chart shows no danger zone temperature.
The chart does not account for metabolic heat generation. Workload category belongs in every heat safety program alongside ambient temperature and humidity monitoring. Understanding how humidity is measured at the worker level, rather than at the heating, ventilation, and air conditioning (HVAC) return, is the starting point for any accurate indoor assessment.
How Humidity Control Affects Heat Stress Risk in Indoor Facilities
Relative humidity is not only an outdoor weather variable. In industrial facilities, it is an actively controlled environmental parameter, and its management directly affects the apparent temperature experienced by indoor workers. Facilities with high-temperature processes, poor HVAC design, or inadequate ventilation can reach indoor heat index values that match or exceed outdoor Danger zone thresholds, even when outside conditions are moderate.
Facility operators who understand the heat stress index chart have a direct reason to treat indoor humidity control systems as a safety-relevant system, not only a product-quality or equipment-protection tool. Maintaining indoor RH within an appropriate operational range simultaneously protects humidity-sensitive processes and keeps the apparent temperature experienced by workers within manageable limits. The appropriate target RH range depends on facility type, processes, and seasonal conditions, so no single universal threshold applies.
Indoor Heat Index: Why Facility Humidity Monitoring Matters
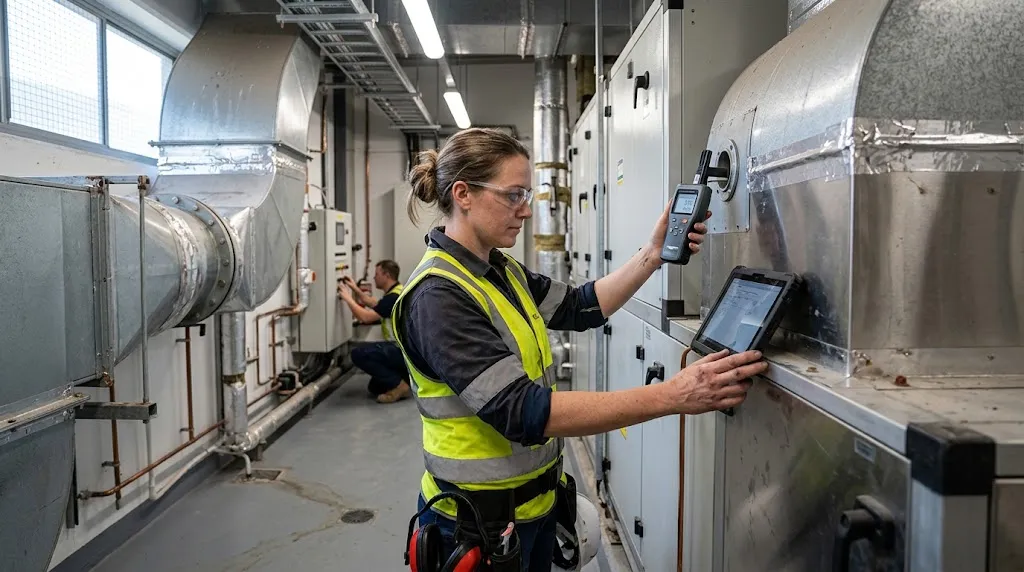
Many indoor facilities do not monitor or report heat index values the way outdoor worksites do, even when internal temperature-humidity combinations warrant the same protective protocols. Environmental health and safety (EHS) officers should apply the same heat stress index chart methodology indoors. Measure both dry-bulb temperature and RH at the worker level, not at the HVAC return. Include radiant heat sources, such as ovens, presses, and processing equipment, in the assessment.
Understanding dew point vs humidity as separate but related variables also helps officers interpret sensor data more accurately in high-temperature indoor environments.
Precision Humidity Control as a Component of Facility Heat Safety
Maintaining a stable indoor RH target gives facility operators direct influence over one of the two variables in the heat stress index equation. When indoor RH fluctuates in response to seasonal changes, production heat loads, or HVAC variability, the apparent temperature experienced by workers fluctuates with it. A facility operating at 85°F with uncontrolled humidity swinging between 50% and 80% RH oscillates between an apparent temperature of approximately 90°F and approximately 99°F. That range crosses the Caution-to-Extreme Caution boundary on the NWS chart without the air temperature changing at all.
Industrial humidification systems designed for precision delivery can hold RH within a defined target band and eliminate that oscillation. Consistent RH control does not replace a complete heat safety program, but it removes a controllable source of apparent temperature variability from the indoor environment.
Maintaining a Stable RH Target in High-Temperature Industrial Environments
Precision humidity delivery in high-temperature manufacturing spaces requires a system that will not introduce surface wetting or condensation risk. Wet surfaces create slip hazards and equipment damage risk. Smart Fog's equal-sized droplet grid produces self-evaporating droplets that disperse into the air before reaching surfaces, keeping floors and equipment dry under proper system design.
The system maintains indoor RH up to 99% RH with plus or minus 1 to 2% precision, enabling facility operators to hold a specific target rather than managing a range. Smart Fog systems are designed for 24/7 set-and-forget operation, with no moving parts in the humidification process and maintenance intervals extending up to every two years. For facilities where heat stress risk is a continuous operational condition rather than a seasonal peak, that reliability matters as much as precision.
Key performance characteristics relevant to heat safety applications:
- RH precision: Up to 99% RH maintained within plus or minus 1 to 2%, eliminating the humidity swings that shift indoor apparent temperature across danger zone boundaries
- Non-wetting design: Self-evaporating droplets prevent surface condensation, reducing slip and equipment risks in high-temperature production environments (note: direct exposure to the fog stream will wet surfaces)
- Continuous operation: 24/7 set-and-forget design with no moving parts in the humidification process, suited to facilities where heat exposure is a year-round operational concern
- Low maintenance: No constant nozzle cleaning required; maintenance intervals extend up to every two years
Evaporative cooling humidifiers designed for industrial settings offer an additional layer of environmental control for facilities where adiabatic cooling alongside humidity management is a priority.
Why Humidity Precision Matters Beyond Product Quality
Most discussions of industrial humidity control focus on process and product outcomes: static discharge prevention, dimensional stability, print quality, and pharmaceutical compliance. The heat stress index chart gives EHS professionals a direct occupational safety reason to treat humidity control as a worker protection parameter.
A facility that can demonstrate stable, documented RH management has a more defensible heat safety program than one relying on ambient weather readings alone. Humidity precision is not only a quality metric. For indoor workers in high-temperature environments, it is an exposure control.
Final Thoughts
The heat stress index chart is a starting point, not a complete safety program. Reading it correctly requires knowing what it measures, what it assumes, and where its documented limitations apply. Direct sunlight, low wind, impermeable PPE, arid conditions, and indoor radiant heat sources all represent scenarios where the standard chart understates actual occupational heat exposure risk. WBGT and ACGIH TLVs fill those gaps for the conditions the chart was not designed to handle.
The occupational safety layer is what most chart references omit. Matching each danger zone to specific work/rest ratios, hydration requirements, and acclimatization protocols is the step that converts a meteorological reference tool into an actionable field guide. That is the gap this resource was built to close.
For EHS officers managing indoor industrial environments, relative humidity is a controllable variable on one side of the heat index equation. Facilities that treat humidity management as a worker safety parameter, not only a product quality control, have a more complete heat exposure program. Request a system assessment for your industrial facility to discuss how precision humidity control integrates with your heat safety program.
FAQ
What is a dangerous heat stress index level for workers?
A heat stress index reading above 103°F apparent temperature enters the Danger zone on the NWS heat stress index chart. At that level, heat exhaustion is likely and heat stroke is possible. Above 125°F apparent temperature, heat stroke risk is imminent and non-essential work should stop. OSHA's heat illness prevention framework recommends structured work/rest ratios and mandatory acclimatization schedules for workers in the Danger zone. Unacclimatized workers should not be assigned strenuous tasks at any reading above 103°F.
How do you read a heat stress index chart when conditions fall between printed values?
When your measured air temperature and relative humidity fall between the chart's printed increments, always round toward the higher apparent temperature rather than interpolating downward. The chart is a baseline tool, not a precise calculator. Rounding down understates heat stress risk. If you have a phone or tablet on site, plugging the numbers into the NWS's free online calculator beats eyeballing the printed chart.
What is the difference between heat index and heat stress index?
Heat index and heat stress index refer to the same calculated value: the apparent temperature combining dry-bulb air temperature and relative humidity to estimate how hot conditions feel to the human body. "Heat stress index" is the term more commonly used in occupational safety contexts, where the reading is applied to worker exposure thresholds and protective action requirements. Both terms describe the Rothfusz regression-based apparent temperature published by the NWS.
At what temperature and humidity does heat become dangerous for indoor workers?
Indoor workers face danger zone conditions when the heat stress index chart, applied to indoor measurements, shows an apparent temperature above 103°F. For example, 92°F air temperature combined with 75% RH produces an apparent temperature of approximately 120°F, which falls in the Danger zone. EHS officers should measure both dry-bulb temperature and RH at the worker level, not at the HVAC return, and apply the same chart thresholds used for outdoor workers.
Why does the standard heat index chart underestimate risk for workers in direct sunlight?
The NWS heat stress index chart is calculated assuming full shade and approximately 5 mph of air movement. Direct solar radiation adds up to 15°F to the apparent temperature compared to the chart's baseline. A crew working a 95°F chart reading in direct sun could actually be facing something closer to 110°F. That's the gap between Extreme Caution and Danger, with nothing about the ambient weather having changed. In still-air conditions below 5 mph, the underestimate increases further.
When should a safety officer use WBGT instead of the standard heat index chart?
Use WBGT when workers are in direct sunlight, when wind speed is below 5 mph, when workers are wearing impermeable PPE, or when ambient relative humidity is below approximately 40%. The standard heat stress index chart was designed for shaded conditions with moderate air movement and does not account for radiant heat load or the evaporation-blocking effect of full-body PPE. WBGT incorporates all three of those variables and is the basis for ACGIH TLV heat stress limits. It is the more accurate tool in any condition the standard chart was not designed for.
What work/rest ratios does OSHA recommend at different heat index danger levels?
OSHA does not publish a single fixed work/rest ratio table tied directly to heat index chart values. Instead, OSHA's heat illness prevention framework recommends that structured work/rest schedules be implemented when heat index values reach the Danger zone above 103°F apparent temperature. The specific ratios are typically determined using ACGIH TLV tables, which factor in both WBGT readings and workload category. Heavier physical work at a given heat level requires more rest than light work at the same reading.
How does wearing impermeable clothing or PPE change heat stress exposure limits?
Impermeable clothing blocks sweat evaporation from the skin surface, removing the body's primary mechanism for body temperature regulation in heat. Workers in chemical-protective suits, full-body coveralls, or heavy industrial PPE experience effective heat stress that can exceed the ambient heat index reading by the equivalent of several degrees. OSHA's Technical Manual addresses PPE as a heat stress modifier. These workers require separate exposure limit calculations and lower work/rest thresholds than workers in standard clothing at the same ambient heat stress index reading.